
Netflix's Average Watch Time Per User Dropped 12% Month-Over-Month. Investigate Why.
PM Interview Question: Problem Solving / RCA question - Netflix's Average Watch Time Per User Dropped 12% Month-Over-Month. Step by step guide using my 6 step framework.

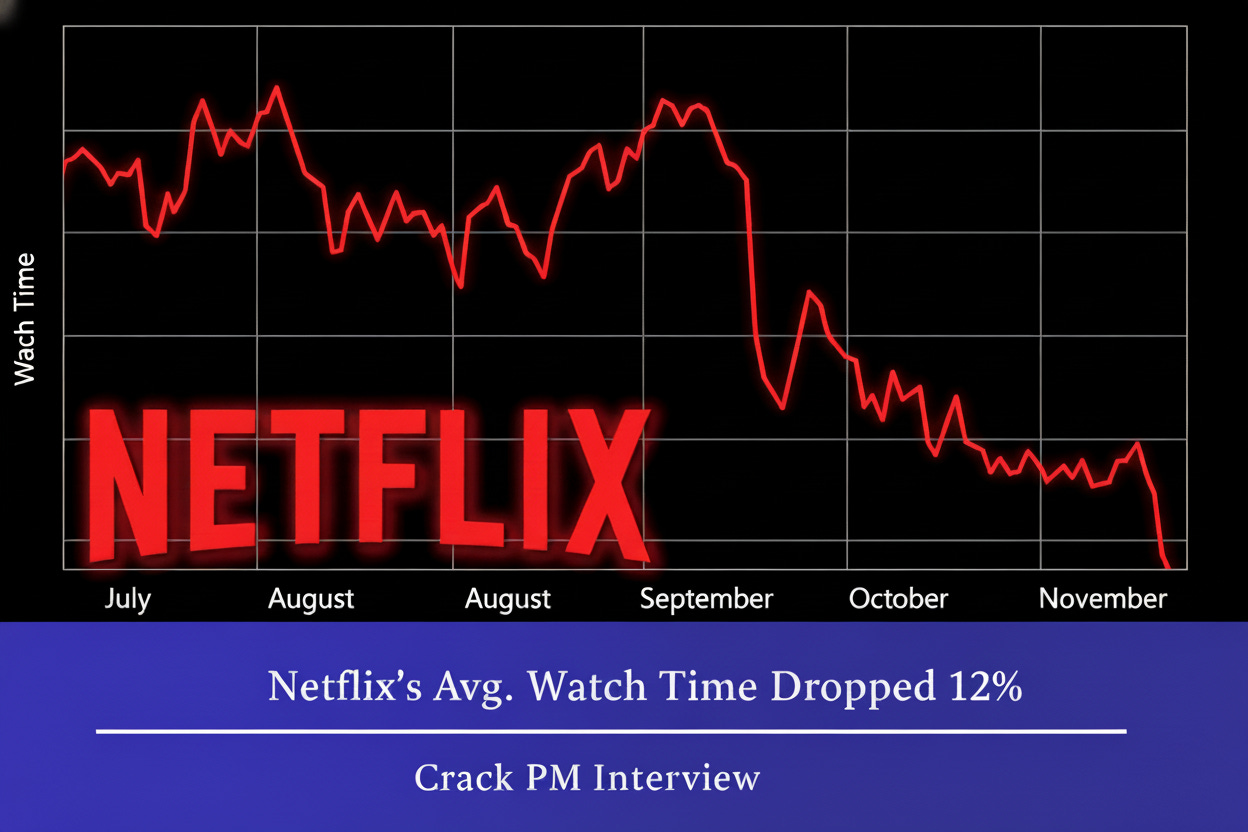
You’re sitting in your PM interview. Everything’s going well. Then the interviewer drops this: “Netflix’s average watch time per user dropped 12% month-over-month. Investigate why.”
Your mind races. Is it a bug? Bad content? Competitors? Seasonality? Where do you even start?
This is the moment that separates good PM candidates from great ones.
Most candidates panic and start throwing out random guesses: “Maybe it’s a technical issue?” “Could be the algorithm?” “Perhaps users are busy?” They’re grasping at straws, hoping something sticks.
But here’s what great candidates do differently:
They don’t guess.
They structure.
They clarify before diving in.
They segment the data.
They prioritize hypotheses.
They validate with evidence.
And they end with concrete recommendations.
Now, let’s dive in and walk you through how I’d approach this question, thinking out loud just like you should in your interview.
Step 1: Clarify the Problem
Before jumping into analysis, I need to understand exactly what we’re dealing with.
Questions I’d ask the interviewer:
About the Metric:
“When you say ‘average watch time per user,’ are we measuring total hours watched divided by all users, or only active users who watched at least one title?”
“Does this include all content types - movies, TV shows, documentaries, and previews/trailers?”
“Is this measured as time with the player open, or actual video playback time?”
About the Timeframe:
“Which month are we comparing? For example, is this September vs August, or October vs September?”
“Was the drop sudden (happened in one week) or gradual throughout the month?”
“Have we checked if this is statistically significant or within normal variance?”
About Scope:
“Is this drop global, or concentrated in specific regions?”
“Are all platforms affected equally - mobile, TV, desktop, tablet?”
“Which user segments are most impacted - new users, long-time subscribers, specific age groups?”
About Context:
“Have there been any recent product changes - new features, UI updates, algorithm changes?”
“Any content library changes - major titles expiring, new seasons launched?”
“Were there any technical issues or outages during this period?”
“What does our competitive landscape look like - any major launches from Disney+, HBO Max, Prime Video?”
Interviewer’s Response: “Good questions. Average watch time is total viewing hours divided by active subscribers (those who watched at least once). This is September vs August data, and the drop happened gradually throughout September. It’s statistically significant at 95% confidence. The drop appears global but we haven’t segmented deeply yet. We did launch a new homepage redesign mid-August, and several popular shows ended their seasons in late August. No major technical issues reported.”
Step 2: Structure My Hypotheses
Now I’ll organize my thinking using the Internal vs External framework.
Internal Factors (Product/Business Related)
Product Changes:
Homepage redesign might have hurt content discovery
Recommendation algorithm changes affecting content suggestions
Autoplay changes (next episode, previews)
Search functionality issues
Profile or settings changes affecting user experience
Content Library:
Popular shows ending seasons (mentioned by interviewer)
Major titles expiring from the library
New content launches being less engaging
Shift in content mix (more movies vs series, shorter vs longer content)
International content changes affecting specific markets
Technical Issues:
Streaming quality degradation
Buffering or loading time increases
App crashes or bugs (even if not “major” outages)
Platform-specific issues (smart TV firmware updates, mobile OS issues)
Business Operations:
Marketing campaign changes affecting user expectations
Email/notification frequency changes
Pricing changes affecting user psychology
External Factors
Seasonality:
September back-to-school effect (less leisure time)
End of summer vacation
Weather changes (more outdoor activities)
Competitive:
Major competitor content launches (new Disney+ shows, Prime Video releases)
Free trials or promotions from competitors
Sports season starting (NFL, soccer leagues) pulling attention
User Behavior:
Return to office reducing daytime viewing
Travel patterns normalizing post-summer
General fatigue with streaming (pandemic binge-watching comedown)
Measurement:
Tracking/logging changes
Bot or fraudulent account cleanup
Metric definition changes
Step 3: Prioritize What to Investigate
Keep reading with a 7-day free trial
Subscribe to Crack PM Interview to keep reading this post and get 7 days of free access to the full post archives.