
How to Answer Problem Solving / RCA Questions in a PM Interview?
Step-by-step guide to answer root cause analysis questions or problem-solving questions in a product management interview.

Product Analytics and Root Cause Analysis (RCA) questions, or also known as problem-solving questions are among the most intimidating yet the most rewarding parts of PM interviews. You’re presented with a problem: “Our daily active users dropped 15% last week” or “Conversion rates fell by 20% after the redesign.” Your job? Figure out what happened and what to do about it.
These questions aren’t just about finding the right answer. Interviewers want to see how you think, how you structure ambiguous problems, and whether you can balance data intuition with business judgment. The difference between a good answer and a great one often comes down to your approach, not your conclusion.
In this guide, I’ll walk you through a battle-tested framework for tackling these questions, common pitfalls to avoid, and real examples to help you practice.
Why Interviewers Ask These Questions
Product Solving or Root Cause Analysis (RCA) questions test four critical PM skills:
Structured thinking: Can you break down a complex problem into manageable pieces?
Data intuition: Do you know what data to look at and how to interpret it?
Analytical rigor: Can you systematically test hypotheses rather than jumping to conclusions?
Business judgment: Do your recommendations make sense given real-world constraints?
These questions mirror what you’ll do everyday on the job: diagnosing why a metric moved, investigating experiment results, or figuring out why a product launch didn’t go as planned.
How to answer root cause analysis or problem-solving questions
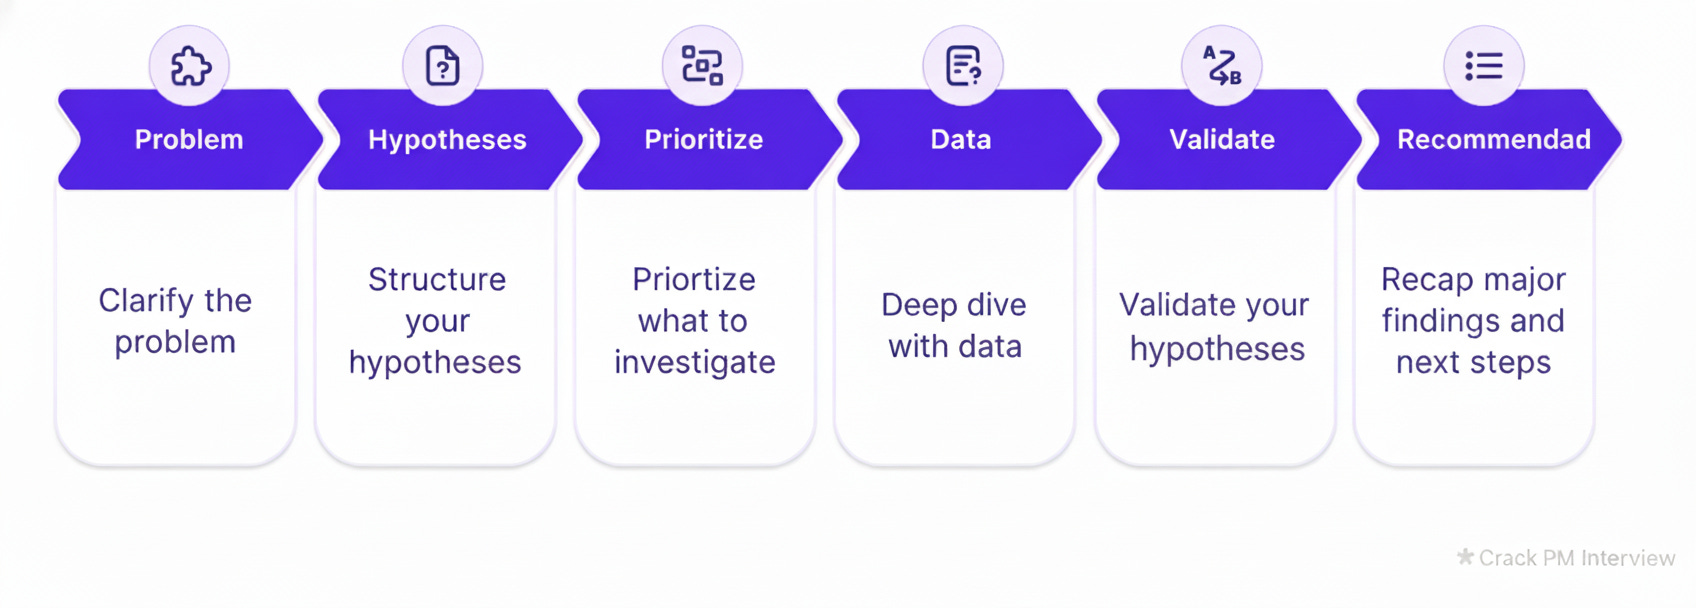
Here’s the framework I recommend for every Problem Solving or RCA question. Master this, and you’ll be able to tackle any variation thrown at you.
Use the below framework
Clarify the Problem
Structure Your Hypotheses
Prioritize What to Investigate
Deep Dive with Data
Validate Your Hypotheses
Recommend Next Steps
Now, let’s dive deep into each step of the framework.
Step 1: Clarify the Problem
Never dive straight into analysis. Start by asking clarifying questions to ensure you understand the problem completely. This shows thoughtfulness and prevents you from solving the wrong problem.
Key questions to ask:
What is the metric exactly? How is it defined and calculated? (e.g., “Is DAU counting unique users who open the app or users who perform an action?”)
What’s the timeframe? When did the drop start? Is it ongoing? Was it sudden or gradual?
How significant is the change? Is this within normal variance or statistically significant?
Any recent changes? New features, experiments, marketing campaigns, algorithm changes?
Which segments are affected? Is this across all users or specific to certain platforms, geographies, or user types?
What do we know already? Has anyone investigated this yet? Any obvious patterns?
Example dialogue:
“Before I dive in, let me clarify a few things. When you say DAUs dropped 15%, over what time period are we comparing? Is this week-over-week, month-over-month? And is this drop uniform across all platforms, or are we seeing variations between iOS, Android, and web?”
Step 2: Structure Your Hypotheses
Once you understand the problem, organize your thinking using a framework. This prevents you from randomly listing ideas and shows structured problem-solving.
Popular frameworks:
Internal vs External Factors
Internal: Product changes, bugs, policy updates, marketing shifts
External: Seasonality, competitors, market trends, regulations
Technical vs Non-Technical Issues
Technical: Bugs, performance issues, tracking errors
Non-Technical: User behavior changes, competitive pressure, content issues
Supply vs Demand Side (for marketplace products)
Supply: Fewer drivers, hosts, sellers
Demand: Fewer riders, guests, buyers
Pick one framework and stick with it throughout your answer.
Step 3: Prioritize What to Investigate
Don’t just list every possible hypothesis. Prioritize which ones to investigate first based on:
Likelihood: How probable is this explanation?
Impact: How much could this explain the metric drop?
Ease of verification: How quickly can we test this?
Example:
“I’d start by investigating internal factors first since they’re most likely and actionable. Specifically, I’d look at: (1) recent product changes since we can quickly check the release log, (2) technical issues since a 15% drop is significant enough that a bug could explain it, and (3) then move to external factors if those don’t pan out.”
Step 4: Deep Dive with Data
Now it’s time to segment the data and look for patterns. This is where you demonstrate data intuition.
Key segmentations:
By User Demographics
Geography (country, city, urban vs rural)
Age groups
New vs returning users
Power users vs casual users
Free vs paid users
By Platform/Device
iOS vs Android vs Web
App version
Device type (phone vs tablet)
Browser type
By Time
Day of week
Time of day
Before/after a specific date
By Funnel Stage
Where in the user journey is the drop happening?
Acquisition, activation, engagement, retention?
Example analysis:
“I’d segment the DAU drop to understand where it’s concentrated. First, let me check if this is platform-specific - if it’s only iOS, that points to an app update or iOS system change. Next, I’d look at geography - a drop in one region might indicate a competitor launch or local issue. Then I’d examine the user funnel: are fewer people opening the app, or are they opening it but not engaging? That distinction changes everything.”
Step 5: Validate Your Hypothesis
For your top hypotheses, think through what data would prove or disprove them.
Example:
“If my hypothesis is that a recent redesign confused existing users, I’d expect to see:
The drop concentrated among users who were active before the redesign
New users unaffected or even showing improved metrics
Correlation with the redesign launch date
User feedback or support tickets mentioning confusion
Drop-offs at specific points in the new flow
If I see all of these, that strongly validates my hypothesis. If new users are also dropping off, I’d need to reconsider.”
Step 6: Recommend Next Steps
End with clear, actionable recommendations that address:
Immediate actions (stop the bleeding)
Rollback the change if it’s clearly harmful
Fix critical bugs
Communicate with users if needed
Investigation needs (gather more data)
A/B test the old vs new experience
Conduct user interviews
Analyze session recordings
Long-term solutions (prevent recurrence)
Improve testing processes
Add monitoring/alerting
Update launch playbooks
Monitoring plan (track if it’s working)
Which metrics to watch
How often to check them
What thresholds would trigger concern
Common Hypothesis Categories (Your Cheat Sheet)
Here’s a quick reference of hypothesis categories to consider for any RCA question:
Internal Factors
Product Changes
New feature launches
UI/UX redesigns
Algorithm changes
Onboarding flow updates
Content/feed changes
Technical Issues
Bugs or crashes
Performance degradation (slow load times)
Login/authentication issues
Payment processing failures
Push notification failures
Business Operations
Pricing changes
Policy updates (privacy, terms of service)
Marketing campaign changes
Email frequency changes
Customer support issues
External Factors
Market Dynamics
Seasonality (holidays, weather, school calendar)
Competitor launches or promotions
Industry trends
Economic conditions
Major news events
Platform/Ecosystem Changes
iOS/Android updates
App store policy changes
Privacy regulations (GDPR, iOS tracking)
Social media algorithm changes
Ad platform changes
Measurement Issues
Data Quality Problems
Tracking/logging bugs
Metric definition changes
Bot or spam traffic
Data pipeline delays
Attribution errors
Sampling issues
Example Walkthrough: Instagram Stories completion rate dropped 20%
Let’s put this framework into action with a real example.
Question: “Instagram Stories completion rate dropped 20% last week. Investigate why.”
Step 1: Clarify
You: “Let me make sure I understand the metric and context. By Stories completion rate, do we mean the percentage of users who watch a Story all the way to the end? And this is averaged across all Stories, not just a specific type?
When you say it dropped 20% last week, is that week-over-week or compared to a longer baseline? Has anyone checked if this is statistically significant or within normal variance?
Also, have there been any recent changes—product updates, algorithm tweaks, or marketing campaigns? And is this drop global or concentrated in specific regions or user segments?”
Interviewer: “Good questions. Stories completion rate is the percentage of opened Stories that are watched to the end. The drop is week-over-week and is statistically significant. We did roll out a new Stories feature last week that adds interactive stickers. The drop appears global but we haven’t segmented deeply yet.”
Step 2: Structure Hypotheses
You: “Thanks. Let me structure my thinking around internal versus external factors, starting with internal since we had a product change.
Internal factors:
The new interactive stickers feature could be causing issues
Technical problems—bugs, crashes, or performance issues
Changes to the Stories algorithm or ranking
External factors: 4. Competitor launched a new feature pulling attention 5. Seasonal patterns or major events 6. User behavior shifts
Given the timing with the sticker feature launch, I’d prioritize investigating that first, followed by technical issues.”
Step 3: Prioritize and Investigate
You: “Let me start with the sticker feature hypothesis. I’d want to segment users into:
Users who have encountered/used the new stickers
Users who haven’t
If the drop is concentrated among users who’ve interacted with stickers, that’s a strong signal. I’d also want to understand:
Are Stories WITH stickers taking longer to load, causing users to bail early?
Are the stickers obscuring content, making Stories less engaging?
Are creators using too many stickers, overwhelming viewers?
Next, I’d check technical metrics:
Are there crash rates or error rates associated with Stories?
Has Stories load time increased?
Any correlation with specific devices or OS versions?
I’d also look at the user funnel:
Are fewer people OPENING Stories (discovery problem)?
Or are they opening but not completing (content/experience problem)?
This distinction is critical—if opens are down, it’s about getting users to Stories. If opens are stable but completion is down, it’s about the viewing experience.”
Step 4: Deep Dive with Data
You: “Let me segment the completion rate drop:
By Story type:
Stories with new stickers vs without
Personal Stories vs branded content
Different Story lengths
By user segment:
Heavy Stories users vs casual
iOS vs Android
Age groups (Gen Z might interact with stickers differently)
Geographic regions
By time:
Is the drop getting worse or stabilizing?
Is there a pattern by time of day?
By creator behavior:
Are certain creators seeing bigger drops?
Has the average number of stickers per Story changed?
My hypothesis is that creators are overusing stickers because they’re new and exciting, but this is making Stories harder to watch or obscuring the actual content. If I see that Stories with 3+ stickers have much lower completion rates than those with 0-1 stickers, that would validate this.”
Step 5: Validate
You: “To validate this hypothesis, I’d look for:
Strong correlation between number of stickers and completion drop
User feedback mentioning stickers being distracting or annoying
Longer dwell time at specific sticker types (suggesting confusion)
A/B test data comparing sticker-enabled vs disabled Stories
I’d also want to rule out alternative explanations:
Check if the drop started exactly when we launched stickers or a day later
Confirm there’s no correlation with a competitor feature launch
Verify there were no infrastructure issues that week
Check if other engagement metrics (likes, replies) also dropped”
Step 6: Recommend
You: “Based on my analysis, here are my recommendations:
Immediate actions:
Run an A/B test: disable the sticker feature for 10% of users and compare completion rates
Review session recordings to see exactly where users are dropping off
Analyze the top 100 most-viewed Stories to see sticker usage patterns
Check if there’s a technical issue causing performance degradation with stickers
Short-term fixes:
If stickers are the culprit, consider limiting the number of stickers per Story (e.g., max 3)
Add design guidelines for creators on best practices
Improve sticker placement so they don’t obscure faces or key content
Optimize sticker loading performance
Long-term solutions:
Develop better in-product education for creators on using stickers effectively
Build a feedback loop: test with power creators before wide release
Add completion rate as a pre-launch metric we monitor for new features
Create a sticker ranking algorithm that de-emphasizes overloaded Stories
Monitoring:
Track completion rate daily, segmented by sticker usage
Set up alerts if completion drops another 5%
Monitor creator adoption curve for stickers
Watch for impact on other metrics: time spent, Story posts per user, retention”
Common Mistakes to Avoid ⚠️
Even with a solid framework, candidates often stumble. Here are mistakes to watch out for:
1. Jumping to Solutions Without Analysis
Bad: “The metric dropped? It’s probably a bug. Let me fix it.”
Good: “Let me first understand the scope of the drop and segment the data before proposing solutions.”
2. Not Asking Clarifying Questions
Diving straight into hypotheses without understanding the context makes you look hasty. Always clarify first.
3. Listing Hypotheses Without Prioritization
Bad: “It could be a bug, or seasonality, or a competitor, or user behavior, or the algorithm, or...”
Good: “Let me prioritize. I’d start with internal factors since we had a recent release, specifically checking for technical issues first, then product changes, and finally external factors if needed.”
4. Analysis Paralysis
Don’t list 20 hypotheses with no depth. Pick 3-5 top hypotheses and go deep on those.
5. Forgetting to Segment
Saying “users dropped off” is too vague. Always segment: Which users? On what platforms? In which flows?
6. Ignoring External Factors
Many candidates focus only on product changes and miss external factors like seasonality, competitors, or market shifts.
7. Weak or Vague Recommendations
Bad: “We should investigate further and monitor the situation.”
Good: “I recommend we immediately A/B test rolling back the feature for 10% of users, conduct 20 user interviews by Friday, and establish daily monitoring of completion rates segmented by sticker usage.”
8. Poor Communication
Being disorganized, jumping between ideas, or failing to explain your reasoning clearly will hurt you even if your analysis is sound.
Pro Tips for Success ✅
Think Out Loud: Interviewers can’t read your mind. Narrate your thinking process: “I’m considering whether this is platform-specific, so let me think about what I’d see if it were an iOS-only issue...”
Be Hypothesis-Driven: Don’t throw out random ideas. Form a hypothesis, then explain what data would support or refute it.
Use Real Numbers When Possible: Instead of saying “I’d check if load time increased,” say “I’d check if load time increased from our baseline of 2 seconds to 3+ seconds, since research shows completion drops significantly after 3 seconds.”
Draw Diagrams: If you’re on a whiteboard or virtual interview, sketch out funnels, segmentation trees, or timelines. Visual aids help both you and the interviewer follow your logic.
Sanity Check Your Answer: Before finishing, ask yourself: “Does this make business sense? Is this realistic? Have I missed obvious explanations?”
Apply the 80/20 Rule: Focus on the hypotheses that could explain 80% of the drop. Don’t waste time on edge cases that would only explain 2-3% of the movement.
Stay Calm When Stumped: If you don’t know something, say: “I don’t have direct experience with that, but here’s how I’d approach finding out...” This shows resourcefulness.
Practice Out Loud: Reading this guide helps, but you MUST practice out loud. Record yourself or practice with a friend. It’s the only way to get comfortable with the cadence of these conversations.
Practice Questions for Problem Solving or RCA Questions
Here are questions to practice with, along with hints to get you started:
Metric Drop Questions
Netflix’s average watch time per user dropped 12% month-over-month. Investigate why.
Daily tweets posted on Twitter decreased by 20% over the past two weeks. What happened?
DoorDash orders per customer fell from 3.2 to 2.4 per month. Diagnose the issue.
Average Zoom meeting duration dropped from 35 minutes to 25 minutes. Why?
Reddit’s DAUs decreased by 8% over the last month. Investigate the root cause.
Funnel Issue Questions
On Amazon, users are adding items to cart normally, but cart-to-checkout conversion dropped from 75% to 55%. What’s wrong?
Uber’s driver sign-up completion rate dropped from 40% to 25% at the background check stage. Diagnose why.
On your dating app, match rates are stable, but match-to-first-message conversion dropped from 60% to 40%. What happened?
Your SaaS product’s free trial-to-paid conversion rate fell from 25% to 18% after changing the trial period from 14 to 30 days. Investigate.
Player completion rate for your game tutorial dropped from 80% to 60% after a redesign. Why?
Anomaly Questions
Venmo transaction volume suddenly spiked 300% on a Tuesday afternoon. What’s happening?
YouTube’s video storage costs increased 40% overnight with no corresponding increase in uploads. Investigate.
Slack messages sent across your organization dropped to near-zero for 2 hours midday. What happened?
Your app normally gets 50 reviews per day, but today you received 2,000 negative reviews. Diagnose the cause.
Profile views for all LinkedIn users increased 250% over 48 hours. What’s going on?
A/B Test Questions
You A/B tested a cleaner homepage design. Variant B has 25% fewer clicks but 15% higher conversions. Should you ship?
Testing increased push notifications: Variant B (3x more notifications) has 20% higher engagement but 30% higher uninstall rate. What do you do?
You tested a $5/month price increase. Variant B has 15% lower conversions but higher revenue per user. Ship or not?
New search algorithm (Variant B) shows 10% faster results but 5% lower click-through rate on search results. What’s your decision?
Variant B adds a personalization survey to onboarding: 20% lower completion but 40% higher Day 7 retention for those who complete. Ship it?
Multi-Metric Questions
YouTube video uploads are up 30% but watch time per user is down 15%. Explain and investigate.
Pinterest engagement (pins, saves) increased 25% but ad revenue decreased 10%. What’s happening?
Spotify premium subscribers grew 20% but premium user listening hours only grew 5%. Diagnose.
Website traffic increased 40% but revenue only grew 10%. What went wrong?
Uber ride volume grew 15% but revenue grew only 5%, while driver earnings stayed flat. Explain.
Growth Issue Questions
Instagram’s Day 1 activation rate (users who post or engage on first day) dropped from 45% to 30%. Why?
Users maintaining 7+ day streaks on Duolingo decreased from 35% to 25% of active users. Investigate.
Medium’s new writer retention (writers who publish second article) dropped from 40% to 28%. Diagnose.
Peloton users’ average monthly workouts declined from 12 to 8 over six months. What happened?
New Discord servers are seeing 30% lower message volume in their first month compared to six months ago. Why?
Geographic Anomaly Questions
Uber Eats order volume in India dropped 40% in one week while other markets are stable. Investigate.
TikTok daily time spent per user in the UK fell 25% while US/EU are flat. Diagnose the issue.
Airbnb bookings in Japan increased 200% in 48 hours with no marketing campaign. What’s happening?
WhatsApp crashes increased 500% in Brazil only, with minimal issues elsewhere. Why?
Shopify stores in Canada are seeing 35% higher conversion rates than US stores suddenly. Investigate.
Key Takeaways
Always clarify before diving in—understand the metric, timeframe, and context
Use a structured framework—internal vs external, technical vs non-technical
Prioritize your hypotheses—don’t list everything, focus on likely culprits
Segment the data—by user type, platform, time, and funnel stage
Think out loud—show your reasoning, not just your conclusions
End with actionable recommendations—immediate fixes, investigations, and long-term solutions
Practice out loud—reading isn’t enough, you need to simulate real interview conditions
Problem Solving or RCA questions can feel intimidating, but with the right framework and practice, you can tackle them confidently. The key is demonstrating structured thinking, data intuition, and business judgment—not necessarily finding the “right” answer (there often isn’t one).
Start practicing today. Pick a question from this guide, set a timer for 20 minutes, and work through it out loud. Record yourself. Notice where you stumble. Then do it again.
The more you practice, the more natural this framework becomes, and the more confident you’ll feel walking into your next PM interview.
If you found this helpful, subscribe for more PM interview guides, frameworks, and practice questions.
 | A guest post by
|